Introduction
Python is a powerful, multipurpose programming language used in plethora of professions such as web development , software development, data science, machine learning and so many more. In recent years, application of python in data science has garnered a lot of audience, this is due to the plethora of python libraries such as Pandas, Numpy, Seaborn, SciPy, Beautiful Soup, Scrapy, and Scikit- Learn, which are used for various stages of data analysis , data science and machine learning.
Structured data are quantitative data often stored in data warehouses. While working with structured data, errors could be made during data entry, hence it is necessary to carry out data cleaning. Working with unclean data leads to inaccuracy in result, the outcome of such analysis becomes unreliable.
Data cleaning is one of the most pivotal stage in data analysis, it is a process which involves removal of errors in a dataset, such as removal of null values, duplicates, outliers, misspellings, incomplete dataset and so many more.
The pandas library, often regarded as the most important python library is used for a variety of purpose, such as data cleaning, analysis, manipulation and exploration. In this article we take a look at how to clean structured data using the python pandas library.
Procedure;
Importing the necessary library:
Importing the pandas library is the first procedure in cleaning structured data.
Import pandas as pd
Load in the dataset:
The structured dataset needed to be clean is then loaded in to the Jupyter notebook to begin the data cleaning procedure.
Code : pd.read_csv()
Example:

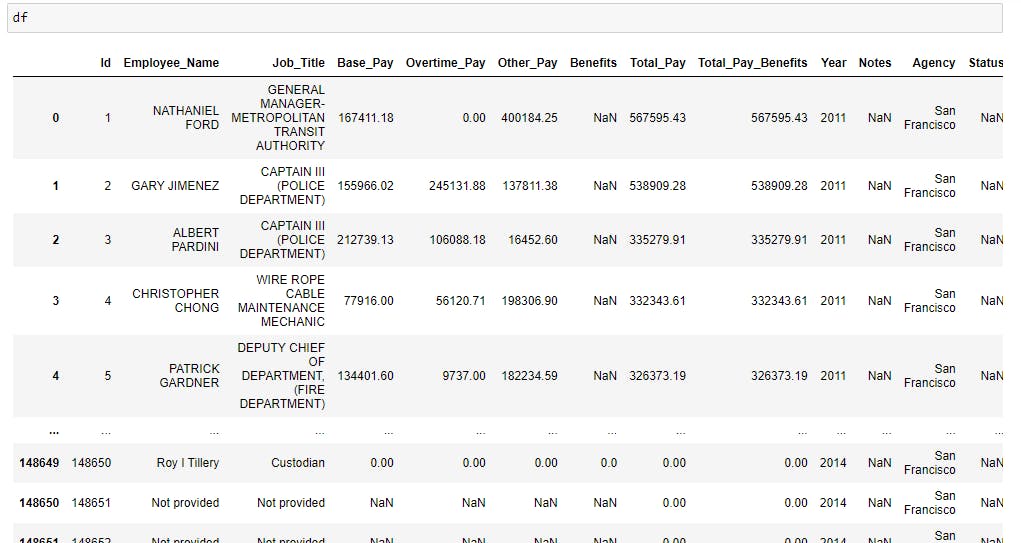
The dataset used for this tutorial is an employees’ record gotten from Kaggle.
Here is a picture of the dataset after being imported into the jupyter notebook:
Data Cleaning Phase
1) Dealing with missing rows:
Working with missing rows could be detrimental to a data analysis project, hence, it is important to check if there are any missing rows across the columns and to decipher on what to do with the missing rows.
Checking for missing rows:
To check for missing rows across all columns, we can either use the .isna() or isna().any() code.
Example: Using .isna()
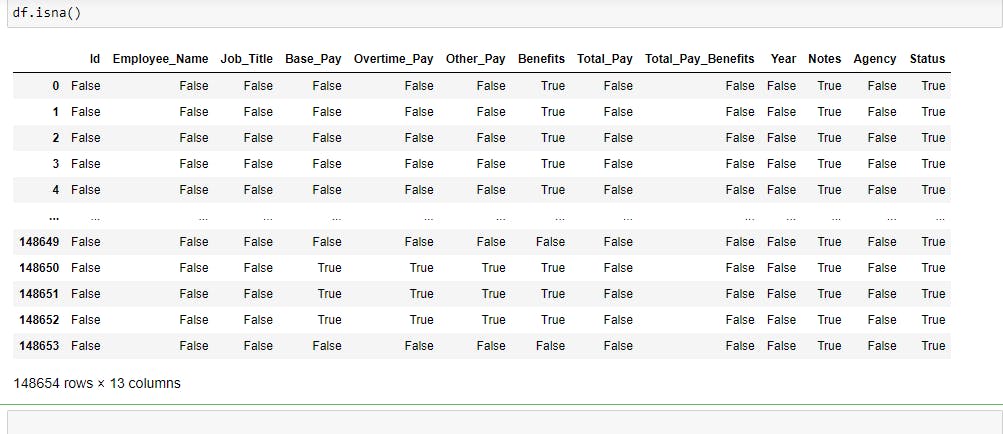
The output shows all rows in the dataset in a boolean format; True or False, which tells us if the row is empty or not.
Example: Using .isna().any()
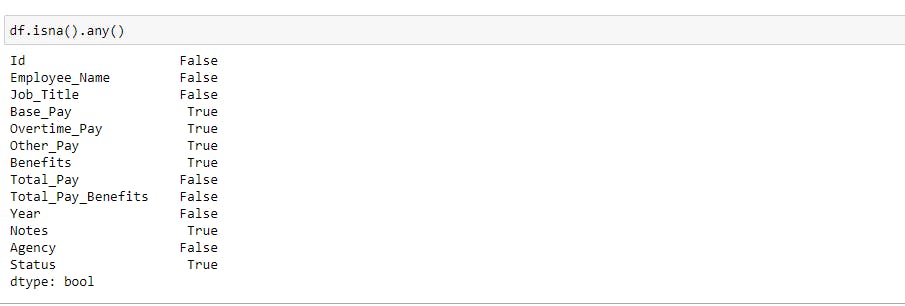
The output returns a list of all columns with a true or false at the front of each columns, with the true and or false symbolizing the presence or absence of missing rows.
Checking how many missing rows are in each column:
To check how many missing rows, we use the .isna().sum() function.
Example:

Filling missing rows:
To fill missing rows, we use the .fillna() function.
Example:

As seen in the picture above, The empty rows in the example above were filled with “00”.
Deleting missing rows:
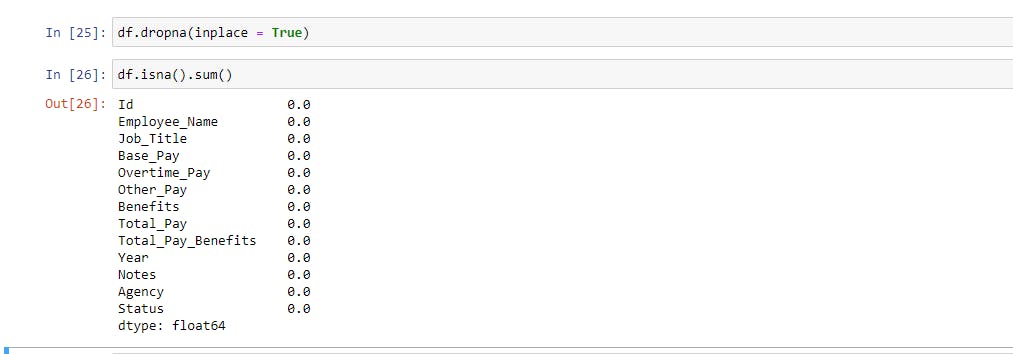
While cleaning a dataset, it could be sometimes necessary to delete missing rows. We use the .dropna() function to carry out this action.
Example:
2) Deleting specific rows and columns:
When working with large dataset or big data, deleting unnecessary rows and columns could be very important.
Deleting rows:
To delete specific row in a dataset, we use the .drop function.
Example:
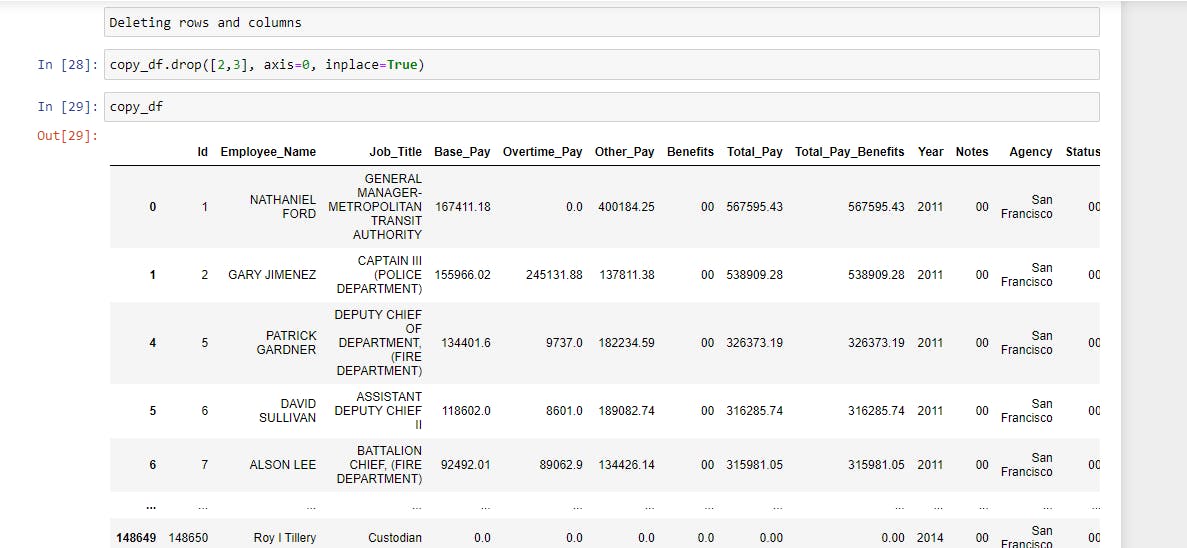
In the example above; 2,3 stands for the index of the row to be deleted, where axis=0 is used to specify rows and not columns. The output above shows row 2 and 3 were deleted .
Deleting Columns:
To delete a particular column in a dataset, we also use the .drop function, stating axis=1.
Example:
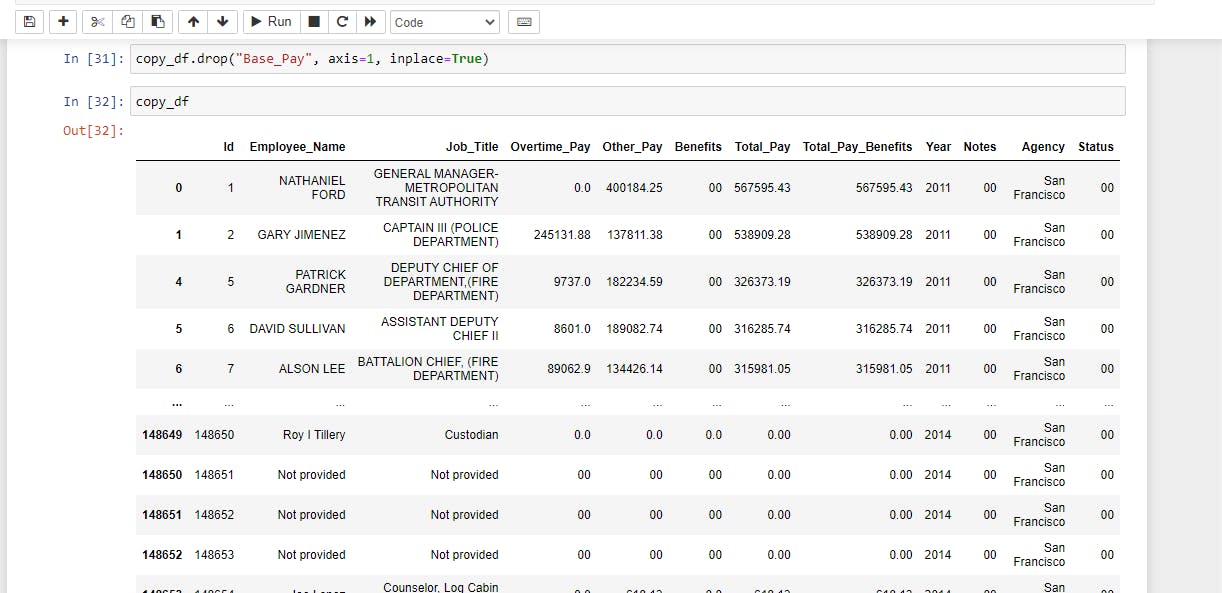
The output above shows the “base pay” column was deleted.
3) Dealing with duplicates :
Duplicates in a dataset doesn’t give a true reflection of the dataset, hence it is necessary to check and delete duplicates while carrying out data cleaning.
Checking for duplicates:
To check for duplicates, we use the .duplicated().any() function.
Example;

The output returns either True or False, confirming if there are duplicates in the dataset or not.
Deleting duplicates:
To delete duplicates, we use the .drop_duplicates function.
Example:
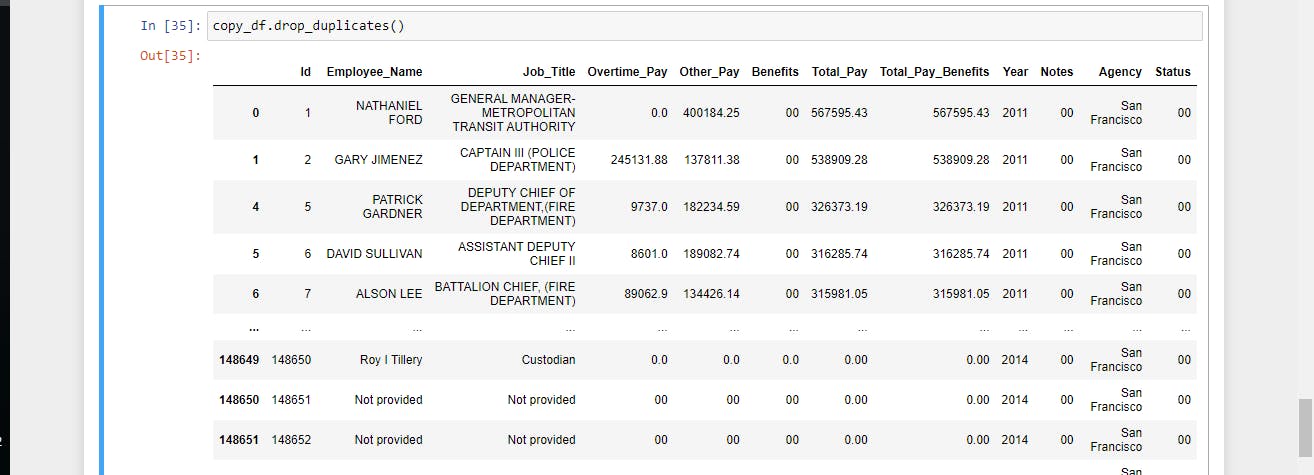
The output returns the dataset without duplicates.
4) Renaming columns:
Renaming of columns could be done to give better understanding of a dataset, or to correct data entry errors. .Rename() function is use for this purpose.
Example:
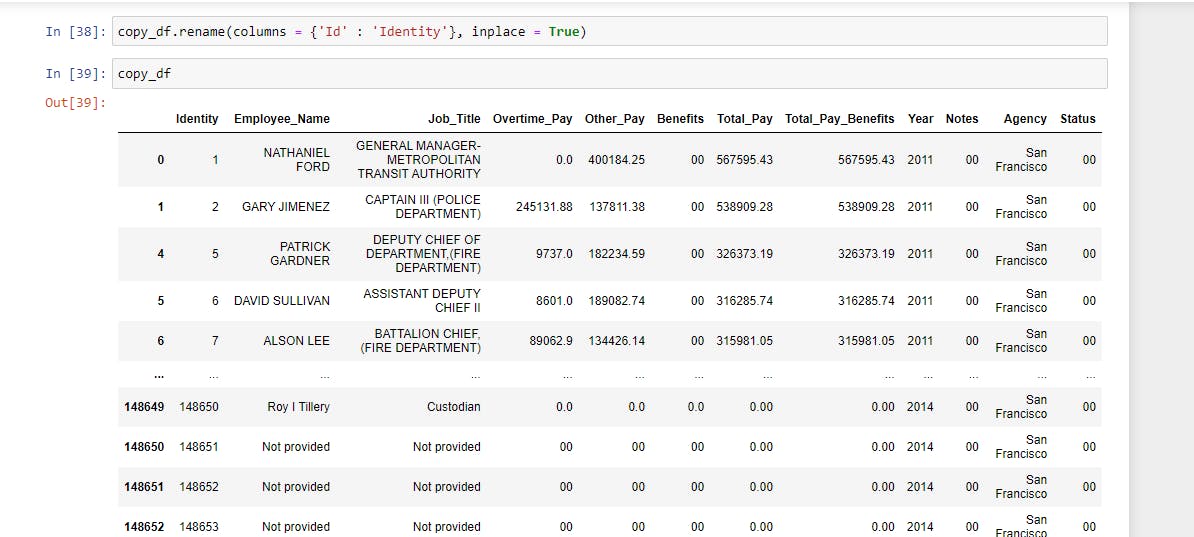
As seen in the example above, the “ID” column was renamed to “Identity” column.
5) Replacing the values in a column:
To replace a specific value in a column with another value, we use the .Replace() function.
Example:
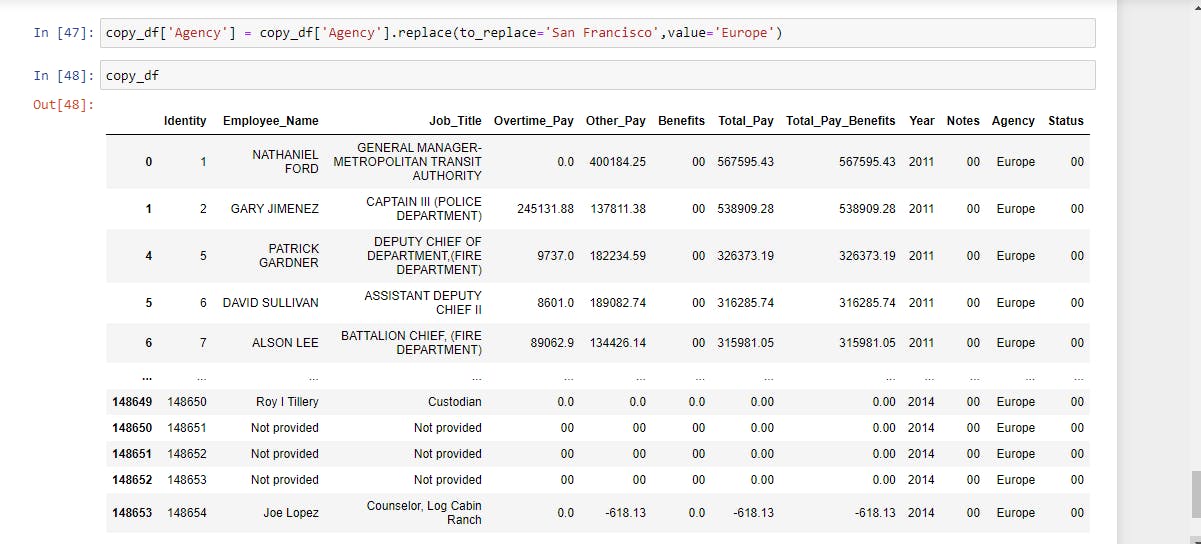
In the example above, “San Francisco “ was replaced with “Europe” in the Agency column.
Final Thoughts
That importance of data cleaning cannot be over emphasized, it is the soul of every data analysis project. With this article, I’m sure you now understand how to clean your data using python.
Thanks for reading.
Happy Coding!😊
